Skip to content
Thabiso KaliEnergy engineer · CEM

Advanced Energy Audit

Where the energy goes, what to do about it, and what it is worth.

An energy audit of the whole plant: a balance reconciled to your bills, every saving quantified once, and a timed, costed route that your engineers and your investment committee can both check.
Opportunity library
49 types
Each quantified by an engineering model
Data levels
1 to 4
From bills alone to process measurements
Deliverables
2 volumes + Excel
Management, engineering, and the model
Methods
ISO 50002
With ISO 50006, ASHRAE Guideline 14 and IPMVP

01The problem

A calculator answers one question. A plant asks all of them at once.

One tool, one answer

Sound on its own

A tool sizes one fix at a time: a VSD on a fan, the right notified maximum demand, a capacitor bank. Each answer is right for the question it was asked, and each assumes nothing else on site changes.

Demo Foods, fictionalAsked on its own, a trim compressor saves 59 MWh a year.
The whole plant

Savings interact

Repair the compressed-air leaks and a variable-speed trim compressor has less left to trim. Tune a boiler and its economiser recovers less heat. Added up tool by tool, a plant's savings come out too high. The audit applies interacting measures in order, each on what the one before left, and shows the overlap it removed.

Demo Foods, fictionalIn sequence, after the leak repair, the same compressor saves 12 MWh.

02The journey

One journey, in three steps.

Every audit takes the site through the same three questions, in order, from one project file. Each step uses the one before it, so the numbers agree from the first page of the report to the last cell of the model.
  1. 01

    Where you are

    Where does the energy go, and how sure are we?

    • Energy and production metrics: kWh per tonne, per m², per degree-day
    • A balance reconciled to the bills, with the unaccounted remainder shown, never forced
    • The energy flow (Sankey) diagram, carrier by carrier
  2. 02

    What you can save

    Which measures, and how much each one really saves?

    • 49 opportunity types tried against the site, each quantified with an engineering model
    • Interacting measures applied in sequence, so no kilowatt-hour is counted twice
    • Firm savings kept apart from indicative ones
  3. 03

    What it costs, and when

    What do we do first, and is it worth the money?

    • Capex and running costs from a cost library, replaced by quotes as they arrive
    • A practical, timed route: behaviour and controls first, then maintenance, retrofits and new technology
    • NPV, IRR, payback, cost per kWh saved and an M&V plan per measure

03What you get

Two report volumes and a model, from the same numbers.

Written for the two people who decide: the one who runs the plant and the one who signs off the money.
  • Volume 1 · Management summary

    For the managing director and the finance team

    • The answer on one page
    • Where the energy goes
    • The projects, ranked
    • Money and timing
    • Risks, and the data that would firm them up
  • Volume 2 · Engineering report

    For engineers and reviewers

    • Data inventory, with the quality of every figure
    • The balance, node by node
    • Each system's model and survey
    • A working sheet for every measure
    • Methods, sources and the M&V plans
  • The Excel model

    For the investment committee

    • Inputs in one place, marked in amber
    • Bills, register and balance
    • Every measure, and the cash flows
    • The portfolio: NPV, IRR, payback
    • Sources and methods, sheet by sheet

Financial lens

Financials a bank can read

For a credit committee, the debt the savings can carry, sized to a debt-service cover ratio.

  • NPV and IRR at your discount rate and tariff escalation
  • Simple payback and the cash flow year by year
  • Cost per kWh saved, and the cost curve (MACC)
  • Firm and indicative savings, kept apart and never added together
  • Tariff scenarios, and what moves the NPV most
  • An M&V plan per measure: the IPMVP option and the baseline

04Why it can be trusted

Built to be checked, not taken on trust.

Every number says how sure it is

Each figure carries a tag and a ± band. Bands combine through the calculations, and a result is never rated better than its weakest input, so you know which estimate to firm up first.

Measured
a bill, a meter, a nameplate
±3%
Calculated
worked from measured inputs
±10%
Estimated
a judgement on site
±15%
Assumed
a default until data arrives
±30%

Default bands, used only where a figure has no stated uncertainty of its own.

  • Standard methods

    The audit process and balance follow ISO 50002-1, the baselines and energy performance indicators ISO 50006, the baseline statistics ASHRAE Guideline 14, and the measurement and verification plans IPMVP and SANS 50010, the standard behind the section 12L allowance.

  • Reconciled, never forced

    The bottom-up estimate for every carrier is tested against what was metered and billed. Whatever the estimates do not explain stays on the diagram as unaccounted, so you can see how far the picture can be trusted.

  • Sources cited

    Every formula, conversion factor and default names its public source. Costs come from a cost library marked as placeholders until a supplier's quote replaces them, and the report says which measures still rest on placeholders.

  • A model you can check

    The Excel workbook holds the audit as live formulas: bills, register, balance, every measure, cash flows and the portfolio. An investment committee can follow any figure back to its inputs, cell by cell.

Data levels: as deep as the decision needs

Set system by system, never for the whole site at once: bills may be enough for the lighting, while the steam plant gets measured.

  1. Level 1±30% or worse

    Bills

    12 to 24 months of bills for every carrier, and a walk-through

    Each carrier's metered total, shared across end uses from the walk-through

  2. Level 2about ±20%

    Inventory

    An equipment register: nameplates, load factors, hours and efficiencies

    Bottom-up energy per item, reconciled to the bills

  3. Level 3about ±10-15%

    Interval

    Half-hourly meter data, sub-meters or loggers, and production

    Measured energy, load profiles and regression baselines

  4. Level 4about ±5-10%

    Process

    Mass flows, temperatures, pressures and the plant historian

    Energy and mass balance per process unit

05From the free tools

The tools answer one question each. The audit answers them together.

The free tools run the same calculation modules the audit uses. A tool result, or a business case built from several, is a fair first look at one idea; the audit is the version for the whole site, checked against its bills.

06The example

See it on a real (fictional) plant: Demo Foods

Demo Foods (Pty) Ltd is an invented bakery and cold store: twelve months of bills, a full equipment register, logged refrigeration and 24 quantified measures. The screens, reports and model below all came out of the audit studio for that one project. Look through them, or download them and check the numbers yourself.
Fictional plant: every name and figure is invented
Energy in a year
6,912 MWh
Electricity, LPG and diesel
Unaccounted
321 MWh
4.6% of metered, shown, not forced
Measures quantified
24
Sequenced, overlap removed
Saving a year
R3.3m
1,873 MWh/yr
Capex
R3.5m
On cost-library placeholders
Cost of saved energy
R0.31/kWh
against R1.74/kWh avoided
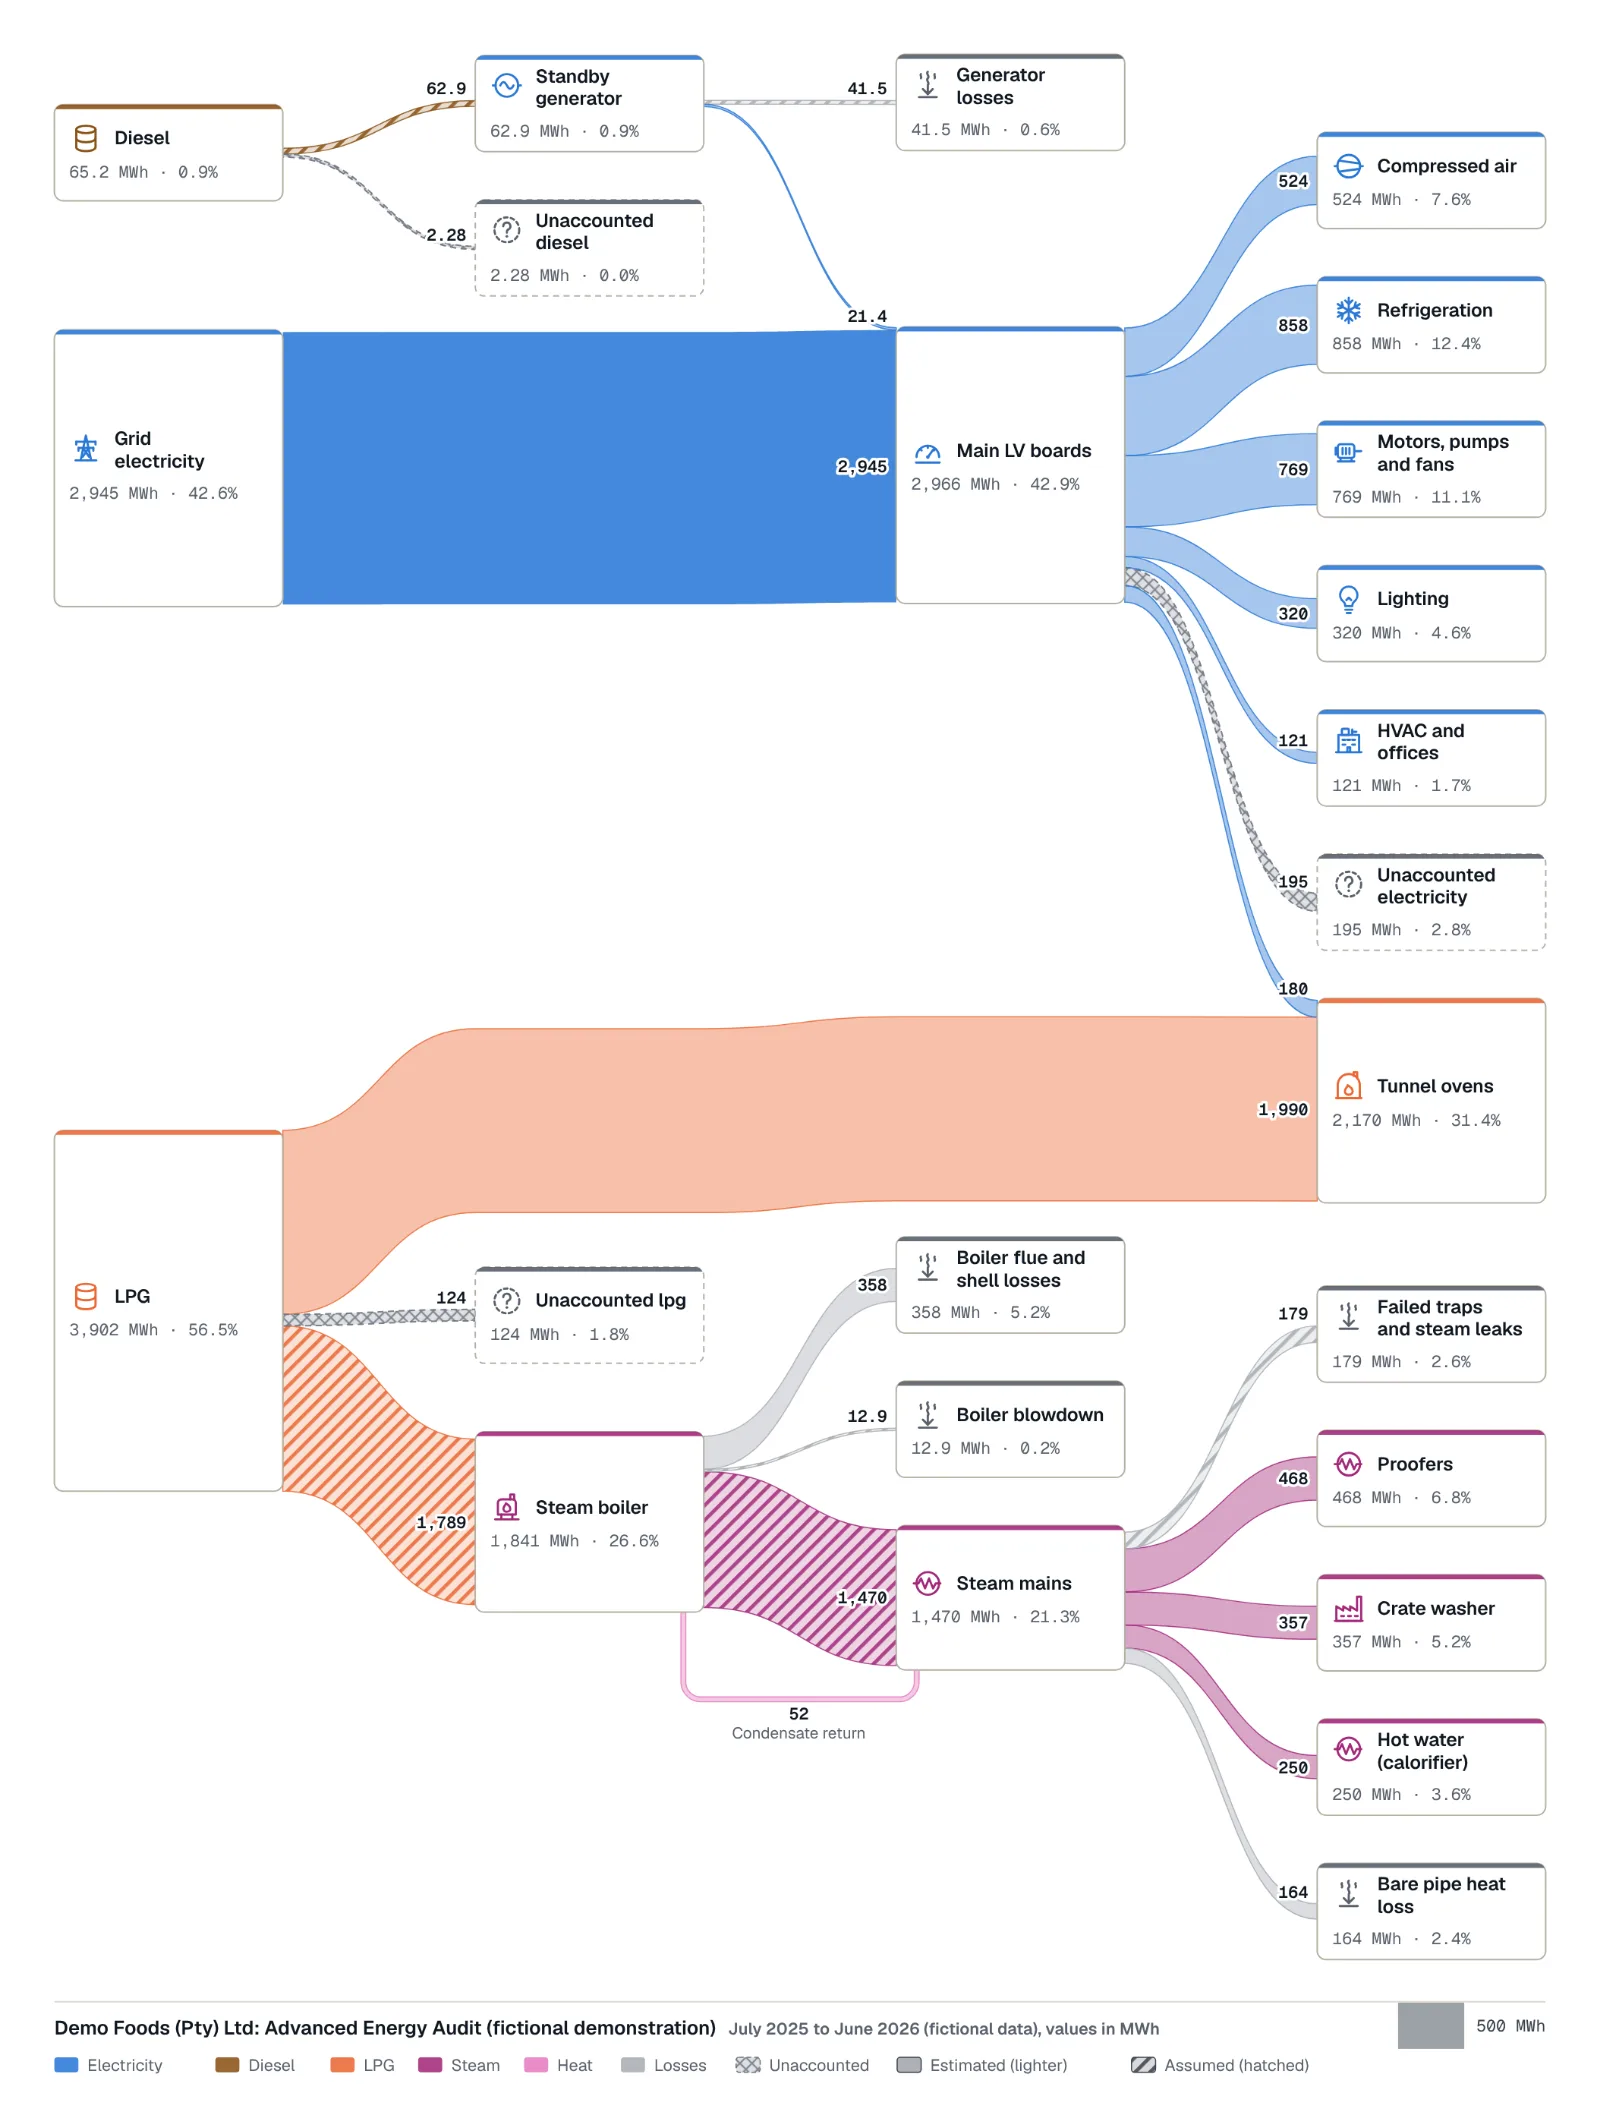
Energy flow diagram, Demo Foods (fictional): The balance drawn to one scale: electricity, LPG and diesel in, end uses and losses out, the unaccounted remainder as its own dashed flow, and hatching where figures are still assumed.

Screen 1 of 5

Energy flow diagram

The balance drawn to one scale: electricity, LPG and diesel in, end uses and losses out, the unaccounted remainder as its own dashed flow, and hatching where figures are still assumed.

Demo Foods (Pty) Ltd is fictional; every figure on screen is invented. Full size

Take the outputs

Demonstration only. Demo Foods' bills, equipment and costs are invented to show the method; capital costs are the cost library's placeholders and three fictional quotes. A real audit replaces them with the site's data and suppliers' prices, and its results will differ.

Interested? Email me.

A line or two about the site is enough to start: what it makes, the energy it buys, and roughly what the bills come to. I reply personally.

thabiso.lungakali@gmail.com